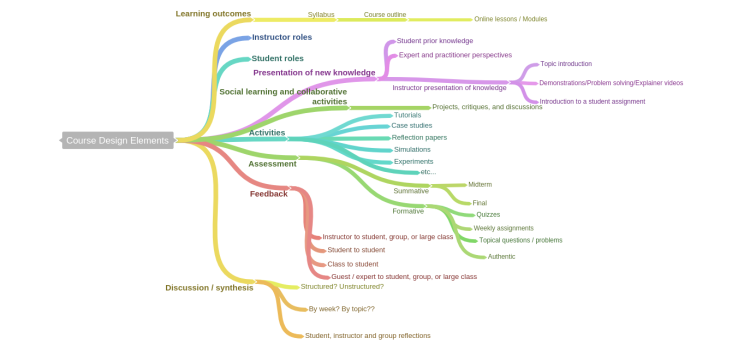
We live in an age where college classes are no longer taught exclusively in classrooms, but rather as a combination of onsite and online learning. In this post, I’m going to share an overview of the blended learning approach to
Why data visualization? Reason #1
To create an interface for our audience to explore our data. There are strong arguments for why we create data visualizations. In this world of big data, visualizations allow audiences to easily explore and understand our statistics through a visual interface.
Teaching with Technology
Learn six very easy ways to use technology as a teaching tool There are many everyday tools out there that can help you achieve specific educational goals in your teaching. But first, let me emphasize that technology should be used in
Designing Experiential Learning: A field example
In a recent article, my colleague and I published Operations Management Outside of the Classroom: An Experiential Approach to Teaching Enabled by Online Learning, which described a course that brought experimental earning to the MBA curriculum. This course is called
Tools for creating interactive educational videos
Many universities and colleges support faculty in the development of robust video lectures. Short videos can replace long lectures, but how does one know if students are actually watching the videos? The Education Group at the W.R. Berkley Innovation Lab evaluated
The Innovative Teaching Professor

January is a good time to reflect on your accomplishments from the previous academic year. Many of us in academia have to provide annual reports on our progress as faculty. From personal experience, I feel that we undersell the work
3 Tips for Data Visualization Driven Stories with Insights

Sometimes imaging software by default enables us to create beautiful visualizations. However, designing visualizations that are readable and provide key insights is much more difficult. As visualization designers, we are “melding the skills of computer science, statistics, artistic design, and
Top 5 Data Visualization Errors

Learn How to Avoid Errors Made by Data Visualization Software Building data visualizations is easy. In fact, you can build beautiful geospatial, categorical, statistical, relational, multivariate, and time series displays with little effort, as long the data is presented in
What is online course design?

Online course design is the planning and development of an online course. It involves the visual, structural, and pedagogical elements of the learning experience. The Essentials of Online Course Design: A standards-based guide (2nd edition) provides educators, administrators, and educational technologists with an online course design roadmap.
Design standards for charts and graphs
These standards are intended to help you create readable and interpretable information visualizations.