I was recently asked to serve on a panel to discuss questions related to increasing analytics engagement for the Digital Analytics Association. In preparation, I put together some questions and responses that I thought would be helpful for folks working in business analytics.
1) What are some ways you see data visualization as helping to increase engagement of analytics in an organization?
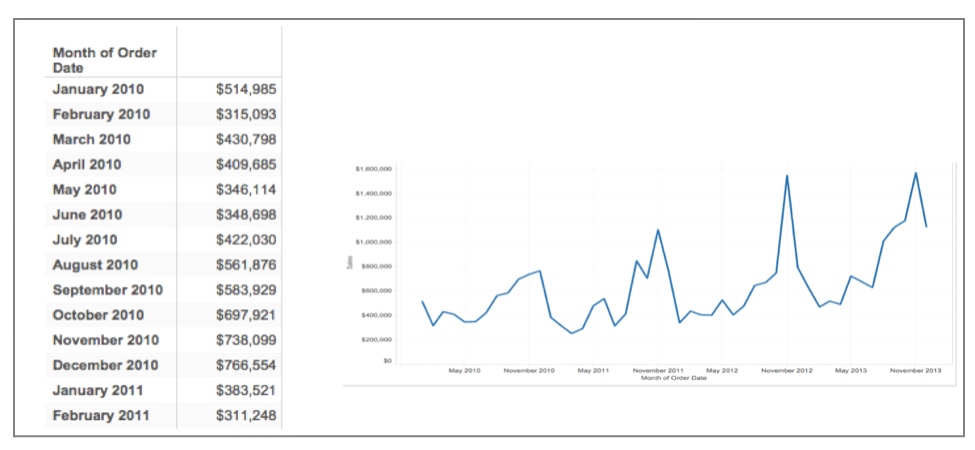
Analytics is not about reporting on what’s happening now, it’s about putting data into context, and transforming it into information and knowledge that we can act upon. Data visualization can communicate insights and findings in ways that spreadsheets cannot. The example below shows how a simple line chart can replace a table of numbers.

2) What are some different uses of data visualization in an organization?
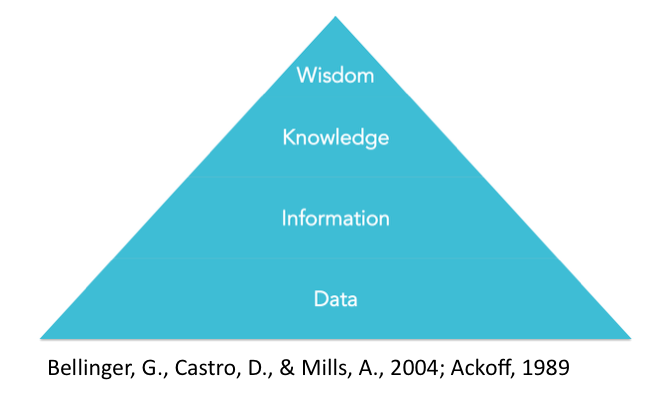
Communication, exploration, presentation, and even as an interface. Most people think visualizations are just pictures to add to your PowerPoint deck. I really see visualizations as a medium. It is a medium that allows us to explore our data, better understand it, and communicate findings to our audience. The goal is to translate the phenomena that is represented in the data into information, and use that information to build knowledge, and eventually wisdom.
3) How does an non-analytics organization become an analytics organization?
It’s about becoming a digital organization. We start simply by ensuring our data is digital and accessible across the business. This helps to reduce data silos. Then we make sure the right people have access to it. Then we empower those people to share and use the data to inform their decisions. A great resource to understand this progression of their decision making is VII Pillars of Productivity.
These three questions reflect some key ways to engage an organization in using analytics.
Kristen Sosulski is an Associate Professor of Information Systems and Director of Education for the W.R. Berkley Innovation Lab at NYU Stern School of Business.

