 There are many books, guides, and tutorials to help you learn data visualization. In this post, I’m sharing a select bibliography of the 16 key readings that I use in my practice and teaching. The readings are diverse; data visualization as a field is interdisciplinary, combining many fields and specialties. Principles, inspiration, and insights are drawn from the areas of statistics, communications, computer science, cognitive psychology, graphic design, information design and user experience design.
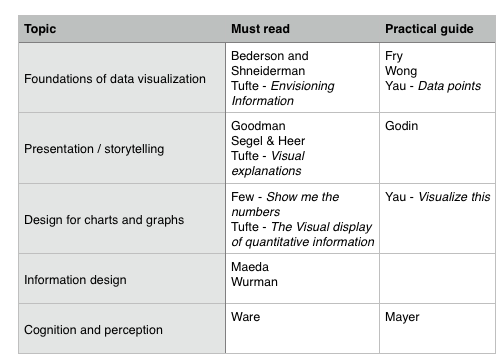
These readings are intended to provide you with a solid foundation of the field, the design principles for charts and graphs, to serve as a guide you for building visualizations, and explain how humans process and perceive visual information.The table below is an organizer to help you decide which readings match your interest by topic and by resource type.
Selected Readings
Bederson, B., & Shneiderman, B. (2003). The craft of information visualization: Readings and reflections. Amsterdam: Morgan Kaufmann.
Few, S. (2012). Show me the numbers: Designing tables and graphs to enlighten. Burlingame, CA: Analytics Press.
Fry, B. (2008). Visualizing data. Beijing: O’Reilly Media.
Godin, S. (2007). Really bad PowerPoint: And how to avoid it. Retrieved August 3, 2016 from http://www.sethgodin.com/freeprize/reallybad-1.pdf
Goodman, A. (2006). When bad presentations happen to good causes. Retrieved August 3, 2016, from http://www.thegoodmancenter.com/resources
Maeda, J. (2006). The laws of simplicity. Cambridge, MA: MIT Press.
Mayer, R. E. (2001). Multimedia learning. Cambridge: Cambridge University Press.
Segel, E., & Heer, J. (2010). Narrative Visualization: Telling Stories with Data. IEEE Trans. Visual. Comput. Graphics IEEE Transactions on Visualization and Computer Graphics, 16(6), 1139-1148. Retrieved August 3, 2016, from http://vis.stanford.edu/files/2010-Narrative-InfoVis.pdf
Tufte, E. R. (1990). Envisioning information. Cheshire, CT: Graphics Press
Tufte, E. R. (1997). Visual explanations: Images and quantities, evidence and narrative. Cheshire, CT: Graphics Press.
Tufte, E. R. (2001). The visual display of quantitative information. Cheshire, CT: Graphics Press.
Ware, C. (2008). Visual thinking for design. Burlington, MA: Morgan Kaufmann.
Wong, D. M. (2011). The Wall Street journal guide to information graphics: The dos and don’ts of presenting data, facts, and figures. New York, NY: W.W. Norton & Company
Wurman, R. S. (1989). Hats. Design Quarterly, (145), 1. Retrieved August 3, 2016, from http://walkerquarterly.s3.amazonaws.com/DQ-145_Hats.pdf
Yau, N. (2013). Data points: Visualization that means something. Indianapolis,
IN: O’Reilly.
Yau, N. (2011). Visualize this: The FlowingData guide to design, visualization, and statistics. Indianapolis, IN: Wiley Pub.
Dr. Kristen Sosulski develops innovative practices for higher education as the Director of Education for the NYU Stern W.R. Berkley Innovation Lab. She also teaches MBA students and executives data visualization, R programming, and operations management as an Associate Professor at NYU’s Stern School of Business.
Kristen’s passion for technology and learning sciences converges in all facets of her career, inside and outside of the classroom. Follower her on Twitter at @sosulski and learn more at https://kristensosulski.com. Stay connected and join her #datavis newsletter.